It’s impossible to take the right business decisions without having insightful information to back up the decision-making process. Open Source Business Intelligence Tools make it easier to have our raw data analyzed and presented in a precise and readable format. In the economics of today’s Big Data projects, it is essential to utilize a proven BI suite to extract meaningful information in an organized manner.
BI technology can provide several potential business benefits, including historical trends, current state and predictive views of business operations with the help of easily understandable visualizations, charts and dashboards. These are pretty useful in analytical data processing, data mining, business performance reporting and benchmarking. Businesses interested in predictive data include streaming services such as Netflix, Disney+, Amazon prime, Gambling sites such as Bodog, PokerStars or SlotsLV, Online retailers such as Amazon, eBay or Etsy or AI Machine learning services offering predictive Stock or Sports outcomes.
Data analytics and business intelligence solutions were traditionally used by large enterprises dealing with Big Data. But the scenario has changed rapidly in the last few years. Today’s BI solutions are increasingly getting used by small and medium-sized organizations to gain better insight into their own business operations.

(Infographic Source: umuc.edu)
There are a number of business intelligence solutions in the market to choose from. Big names in the IT world, such as Microsoft, IBM, Oracle and SAP, have their own proprietary products which are immensely popular among the larger enterprises. While the commercial BI suites can be quite expensive – especially for the small businesses, luckily there are some great open-source alternatives as well. Licensed under GPL, these open source tools are typically used by small to mid-sized businesses, but a few are gaining traction among the large enterprises as well.
In this article, we present you a hand-picked list of 4 open-source business intelligence tools that are ideally suited for businesses with a limited budget.
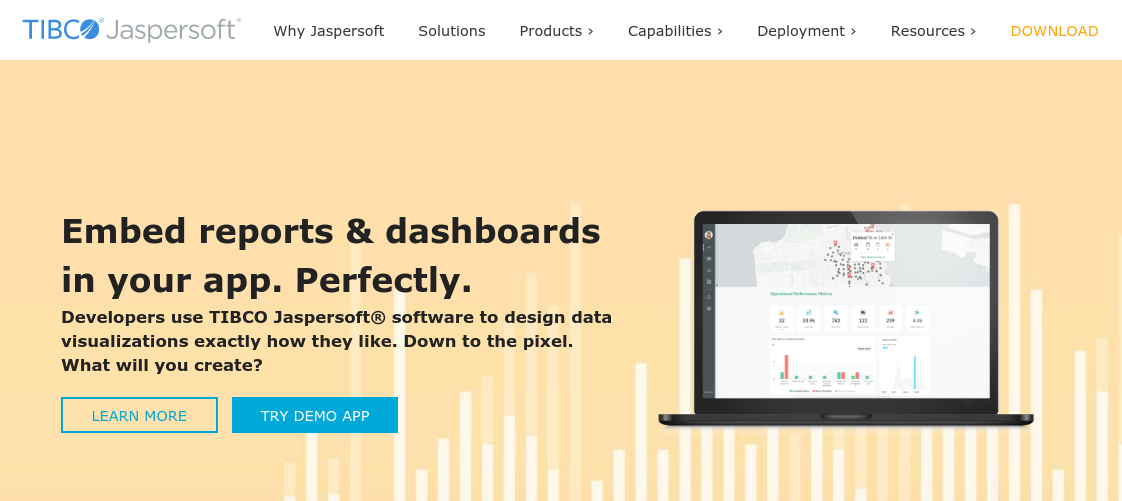
JasperReports Server is one of the leading embeddable open-source business intelligence solutions in the market offering data analytics and reporting capabilities. It allows businesses to refine the decision-making process through highly interactive reports and dashboards. The product is bundled with a report builder interface, a reporting engine, a data repository and a mobile BI app. JasperReports is tailored to work with all operating systems and mobile platforms, including but not limited to Microsoft Windows, Linux, FreeBSD, Android and iOS.
The report builder allows you to customize the reports as per your requirements. You can even modify the code to suit your needs. It has a self-service portal that supports charts, graphs, widgets, crosstabs and other interactive reporting elements. JasperReports is compatible with any data source provider, allowing it to extend reporting capabilities to almost any third-party application.
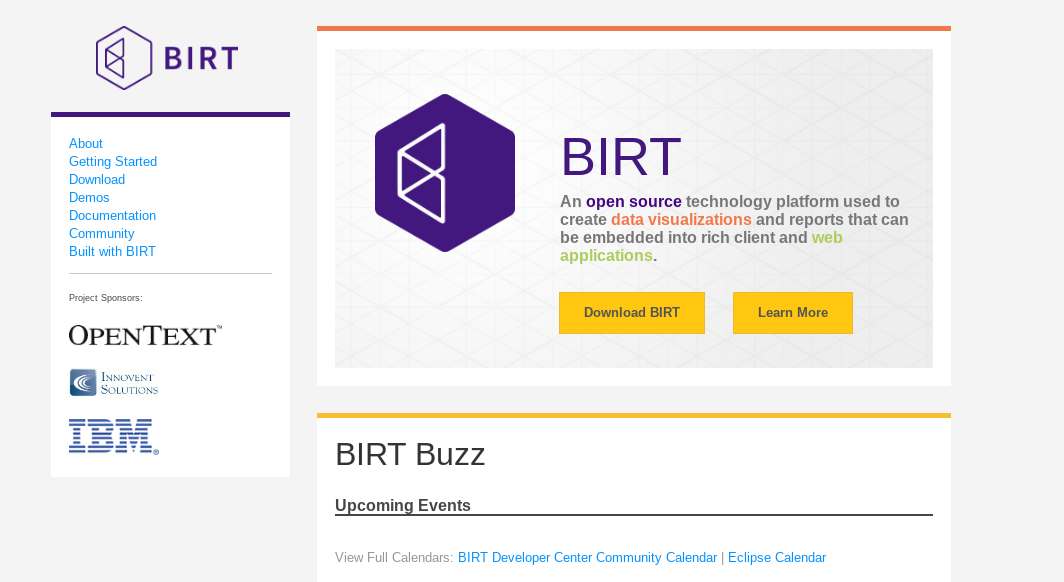
BIRT stands for Business Intelligence and Reporting Tools. It is an open-source software that provides a powerful set of features. BIRT has been around the scene for well over a decade and is often viewed as the standard in open source business intelligence.
BIRT is known for its strong design and presentation features. It has two main components – a report designer, a run-time environment and a chart engine that lets you add graphical representations to your reports. BIRT can either be deployed as a standalone reporting solution or embedded within client applications via its Design Engine API.
BIRT is compatible with all sorts of data sources – including SQL, XML and JDO. Reports can be generated in a variety of formats such as PDF, XML and CSV. BIRT enjoys a strong developer community support. There are plenty of resources and documentations available to help you with the BIRT implementation process.
Zoho Reports is a business intelligence and data analysis tool offered by Zoho, a suite of online productivity tools. It provides features such as interactive dashboards, reports, data visualization, and collaboration tools. Zoho Reports integrates with other Zoho tools and supports multiple data sources, including cloud-based and on-premise databases. It’s designed for small and medium-sized businesses, offering an affordable and easy-to-use solution for data analysis and decision making. With its drag-and-drop interface, users can quickly create custom reports and charts without any technical expertise. Zoho Reports also offers a mobile app for accessing insights on-the-go.
ClicData is a cloud-based business intelligence platform that helps small businesses turn their data into insights. It provides data visualization, reporting, and dashboards to help you make better data-driven decisions. With ClicData, you can connect to various data sources, including spreadsheets, databases, and cloud apps, and create interactive reports and dashboards to monitor your business performance. By using ClicData, small businesses can improve data accuracy, save time and effort, and make more informed decisions, leading to increased efficiency and profitability.
Pentaho is a comprehensive business intelligence solution that caters to data integration, analytics, reporting and data mining. It is available in two editions – a subscription-based enterprise edition and an open-source community edition. Although the enterprise edition is loaded with some extensive features that are not available with the free edition, the open-source version is still very compelling and can serve the purpose of data analysis and reporting well enough.
The biggest strength of Pentaho is its ease of use. It has an intuitive web-based data access wizard and an interactive reporting interface. Interactive visual analysis allows decision makers to find patterns and anomalies, including geo-mapping, heat grids and scatter/bubble charts. Drill-down functionality in the reports and dashboards provides the ability to perform deeper analysis.
Pentaho is compatible with Windows, Mac and Android devices. It supports data integration across different data types. You can access, manage and blend data from multiple sources – from MS Excel to Hadoop.
SpagoBI is a business intelligence and reporting platform fully loaded with features for data mining, reporting, and analysis. It’s a fully open-source project and there’s no premium version available. SpagoBI was introduced back in 2005. Over the years, it has built a strong base of users with great community support.
SpagoBI boasts of powerful features when it comes to data analysis and reporting. It offers developers a wide variety of analytical functions. Moreover, it has an impressive set of advanced data visualization features including geospatial analytics and mapping. OLAP analysis, user-defined KPIs, and real-time dashboards allow business users to dig into huge volume of data to gather decision-making insights. On top of these reporting and analytics features, SpagoBI offers metadata management and ETL functionalities as well.
Microsoft Power BI is a data visualization and business intelligence tool that provides interactive and actionable insights from various data sources. It offers features such as dashboards, reports, data modeling and collaboration to help organizations make data-driven decisions. Power BI integrates with other Microsoft products and also supports non-Microsoft data sources, making it a flexible solution for businesses. It’s cloud-based and also offers mobile apps for accessing insights on-the-go. Power BI is easy to use and offers a range of pricing options for different business needs.
Tableau Public is a free data visualization tool provided by Tableau Software. It’s designed for individuals and non-profits to explore and share public data with interactive and engaging visualizations. Tableau Public connects to various data sources and allows for the creation of interactive dashboards, charts, and maps. The created visualizations can be shared and embedded on websites or social media platforms. Tableau Public offers a simple and intuitive interface, making it easy for anyone to create professional-looking visualizations with no prior experience. Although free, it’s limited in terms of data storage and advanced features compared to Tableau’s paid products.
Helical Insight is a business intelligence platform that enables organizations to access and analyze large amounts of data from various sources. It offers features such as interactive dashboards, reports, and data visualization tools to help users make informed decisions based on real-time insights. Helical Insight provides an easy-to-use interface and supports multiple data sources, making it a suitable choice for organizations of all sizes.
ReportServer is an open-source business intelligence platform that provides a comprehensive solution for reporting, data analysis, and visualization. It offers features such as dashboards, reports, scheduling, and data integration with multiple sources. ReportServer has a web-based interface and can be customized to meet specific business needs. It also supports multiple output formats, making it easy to share insights and findings with others. With its open-source nature, ReportServer provides a cost-effective alternative to proprietary BI tools. Additionally, its active community of developers and users provides continuous support and improvement.
Alongside the traditional proprietary software products, there are quite a few open-source BI suites available in the market. Depending upon the scale of your operations, an open-source BI suite can be competent enough to meet your needs. Having said that, you should carefully evaluate all the options available in the market before making the final call.
By Gary Bernstein