
Recurring revenue is the secret sauce behind the explosive growth of powerhouses like Netflix and Uber. Unsurprisingly, recurring revenue is also quickly gaining ground in more traditional industries like healthcare and the automotive business. In fact, nearly half of U.S. businesses have adopted or are planning to adopt a recurring revenue model, now one of the dominant sales models in today’s connected Digital Economy.
Today, 226 million-plus adults take advantage of online subscription models, and the average consumer spends more than $850 in monthly subscription services, including: auto insurance, cell phone plans, health care premiums, and, of course, household utilities (cable, Internet, etc.). While impressive, these numbers will skyrocket as businesses continue to move towards usage-based services at the core of the Internet of Things (IoT), which is expected to total $8.9 trillion in sales by 2020.
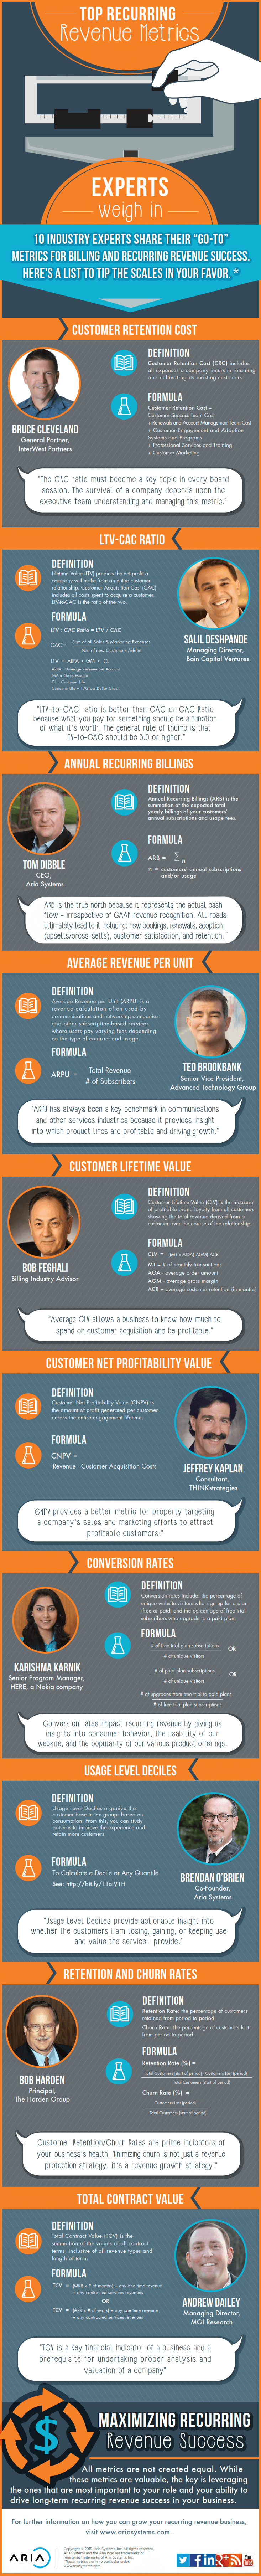
Yet, success isn’t as simple as the plug and play philosophy that some might suggest. Selecting the right technology, business process, and pricing model is just the beginning. Seasoned pros measure performance every step of the way to maximize customer lifetime value and success.
I’ve tapped the experts and asked them to weigh in with their “winning formulas.” Their responses reflected that while there’s a core set of key indicators, there’s plenty of discussion about which “go to” metric best predicts recurring revenue success.
And while there’s no particular order to the core metrics listed below, the importance of each varies with the individual business and its goals. Each is a solid indicator of a healthy (or unhealthy) recurring revenue business. Helping businesses get and stay competitive is the impetus.
My personal pick is a summation of the expected total yearly billings of your customers’ annual subscriptions and usage fees. ARB is what I call the “true north” because it represents the actual cash flow irrespective of GAAP revenue recognition. All roads lead to ARB, including: annual contract value, renewed bookings, upsells, cross-sells, and retention. It’s essential in understanding your success in building customer relationships.
ARB shows you the big picture over time of how your recurring revenue efforts are performing, but you can also use it more granularly. For example, you can track recurring revenue generated from new sales versus renewals or from upsell/cross-sell. Conversely, you can also apply ARB to monitor losses from downgrades, churn, and so forth.
Aria Systems’ co-founder, Brendan O’Brien, looks to Usage Level Deciles to make business decisions based on customers’ consumption over time. A decile is simply defined as “any of the nine values that divide the sorted data into ten equal parts, so that each part represents 1/10 of the sample or population.” Correspondingly, Usage Level Deciles look at usage across the entire customer base, and then break everyone into ten groups. With this, you can then graph usage patterns and study how these patterns change over time. “Usage Level Deciles provide actionable insight into whether the customers I am losing, gaining, or keeping use and value the service I provide,” O’Brien says. For example, “you can study churn rates for each decile to gain insights into customer behavior and improve retention. If customers in high usage deciles are churning at accelerated rates, product and customer experience needs to improve. If customers in low usage deciles are churning more frequently, further training and adoption measures might be in order.”
A key metric from Andrew Dailey, Managing Director of MGI Research, measures Total Contract Value (TCV). It is the summation of the values of all contract terms, inclusive of all revenue types and length of term. “TCV is a key financial indicator of a business and a prerequisite for undertaking proper analysis and valuation of a company,” said Dailey.
A metric from Ted Brookbank, Senior Vice President of Advanced Technology Group, determines the average revenue per unit (ARPU). The ARPU is a revenue calculation often used by communications and networking companies and other subscription-based services where users pay varying fees depending on the type of contract and usage. Brookbank says, “ARPU has always been a key benchmark in communications and other services industries because it provides insight into which product lines are profitable and driving growth.”
Karishma Karnik, Senior Program Manager of HERE, a Nokia company, looks at conversion rates (CR). CR includes the percentage of unique website visitors who sign up for a plan (free or paid) and the percentage of those who sign up for free trials and upgrade. “Conversion rates impact recurring revenue by giving us insight into consumer behavior, the usability of our website, and the popularity of our various product offerings,” Karnik explains.
Jeffrey Kaplan, Consultant at THINKStrategies, favors Customer Net Profitability Value (CNPV). It measures the cost of acquisition and retention against the revenue provided by each customer. “CNPV provides a better metric for properly targeting a company’s sales and marketing efforts to attract profitable customers,” says Kaplan.
As noted, an increasing number of businesses are adopting recurring revenue models. They allow customers to have a plethora of options, including more creative packaging, promotions, and delivery of goods and services.
And, while these metrics are valuable, they aren’t created equal. It’s important to understand what the business’ individual goals are and pay attention to metrics specific to measuring against those goals. Choose ones that fit your business model, pay attention to what they tell you, adjust accordingly, and then repeat. Quarter after quarter. Year after year.
For more information and additional metrics, see the corresponding infographic below.
By Tom Dibble